Research
People
Teaching
National cooperation
International cooperation
Usefull links
UCHT Prague
Uv-Vis spectroscopy & Photochemistry
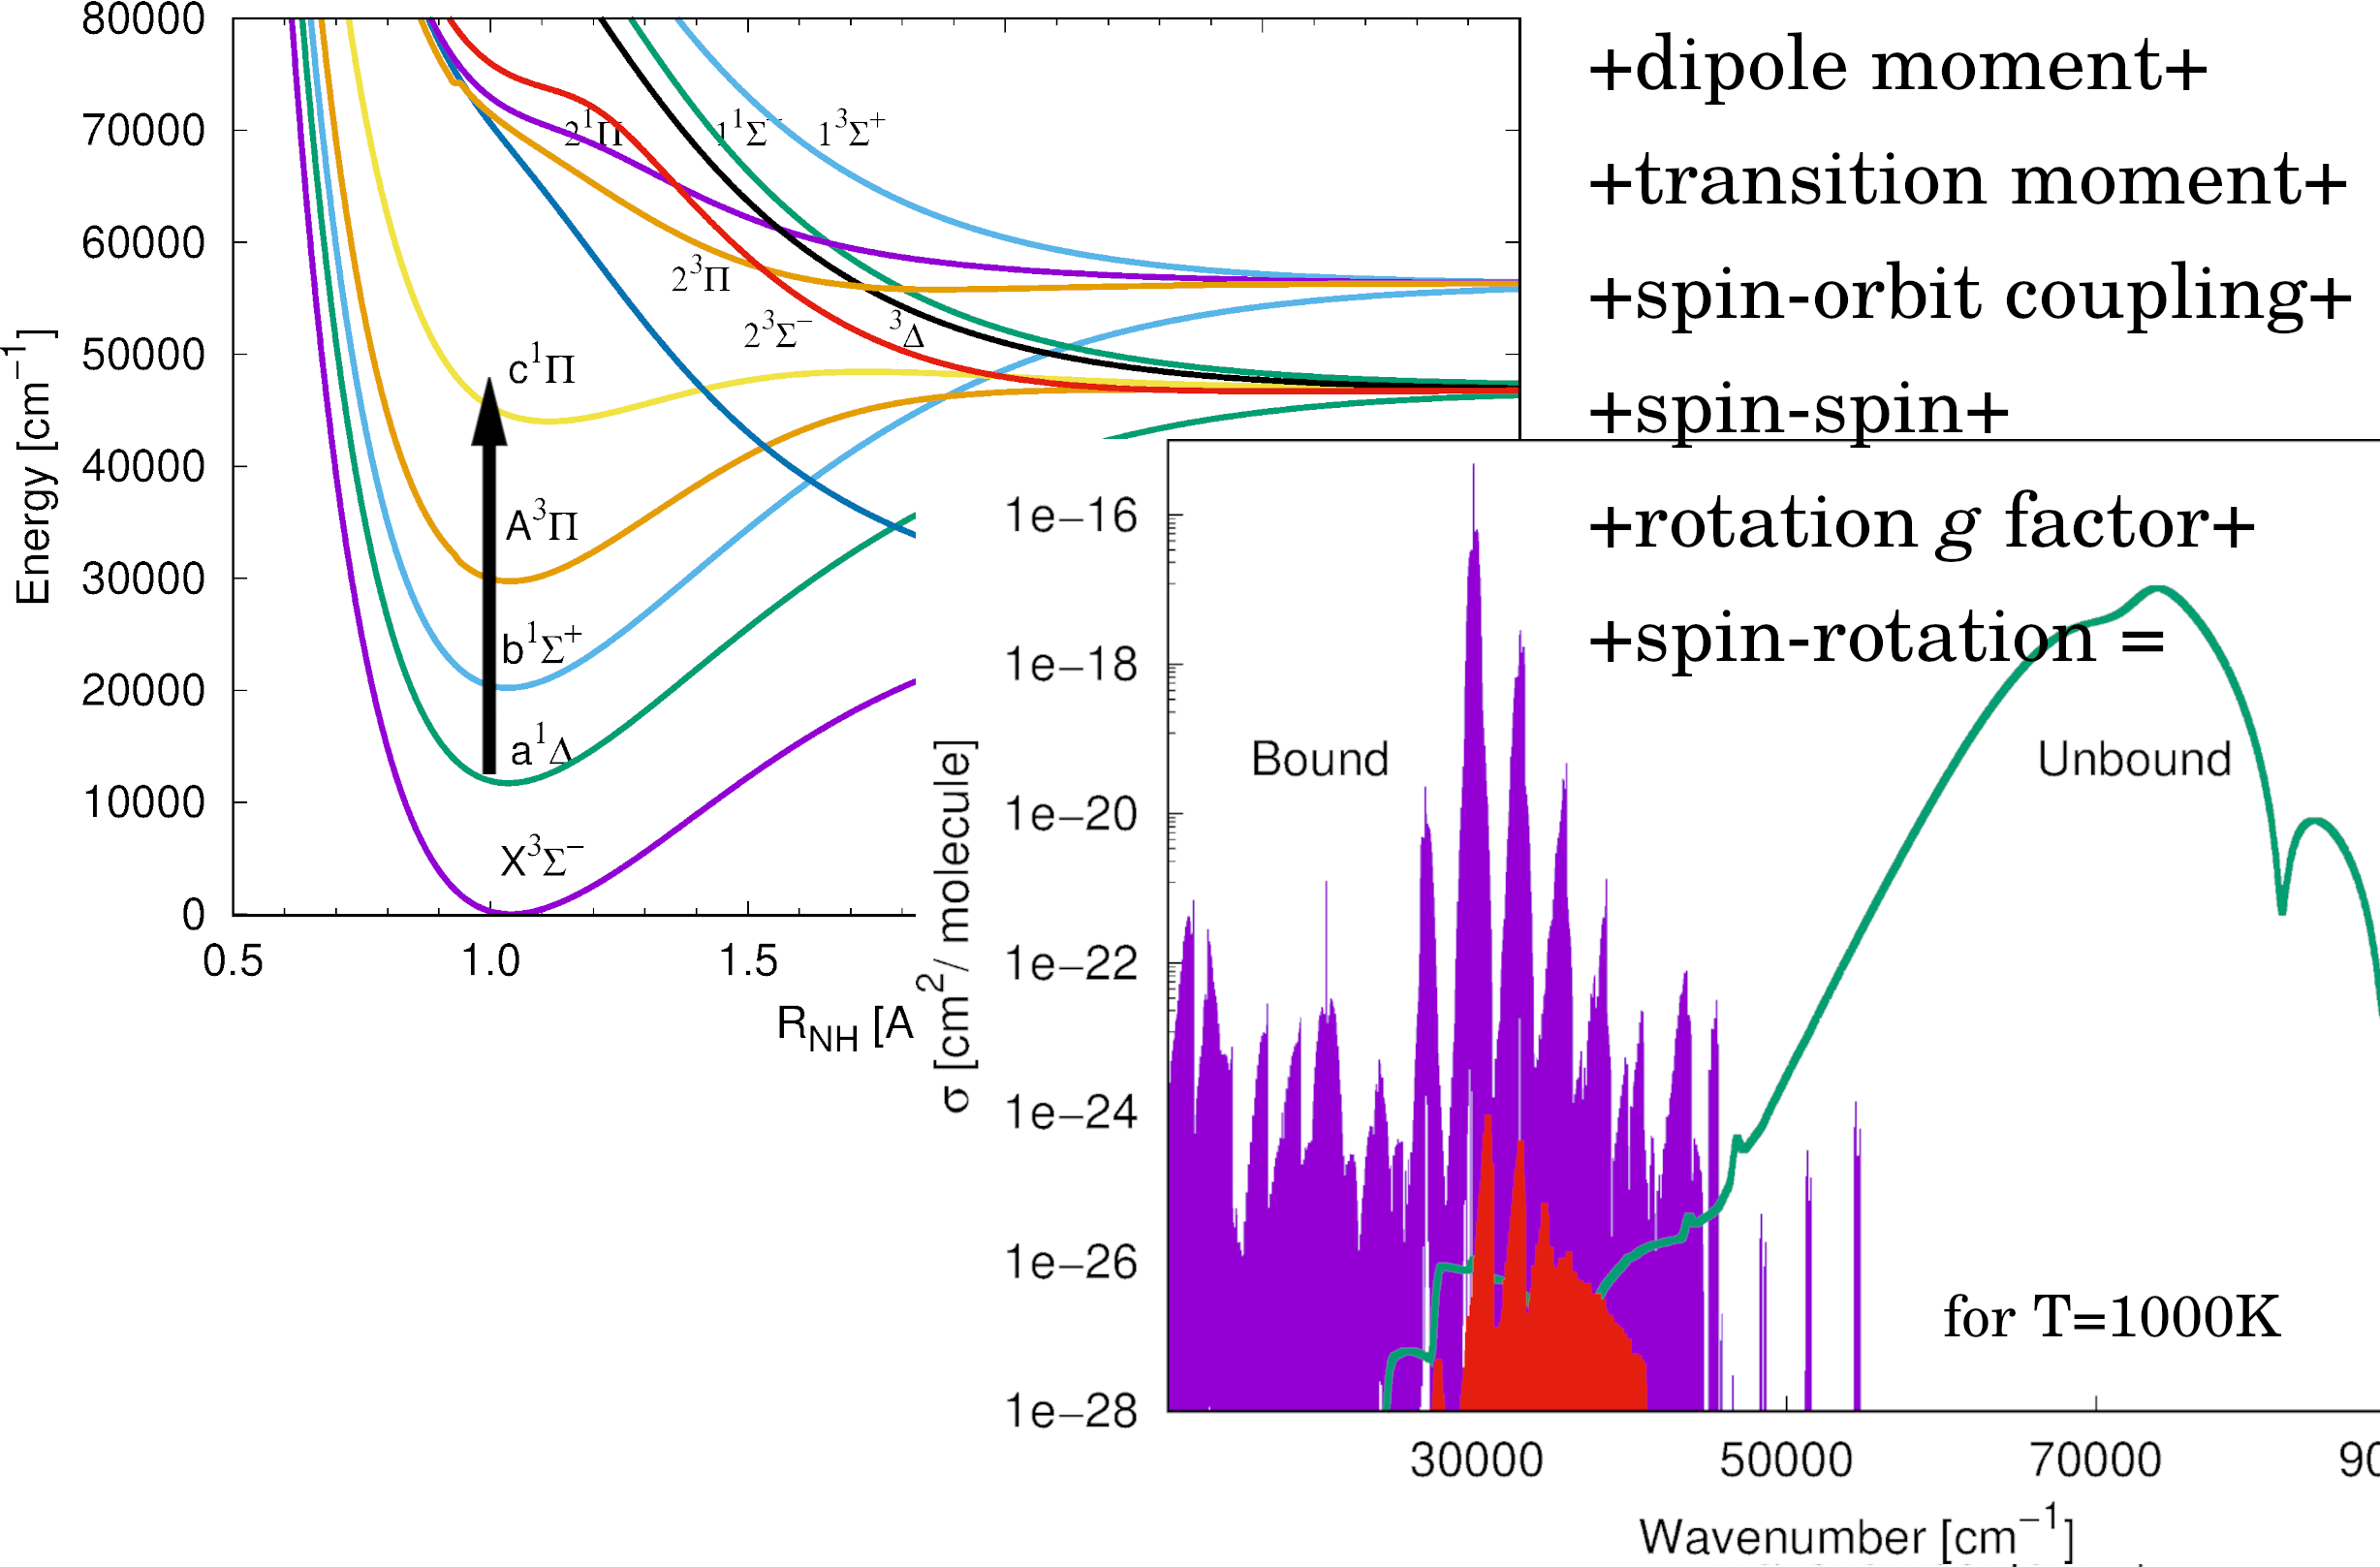
Photoabsorption cross sections
A tool for molecular probing over different kind of environments.
Revealing resonances states
Illustration of the complex scaling transformation of a many-body Hamiltonian. Due to its the poles of S-matrix can be reveal when continuum is rotated to complex plane.
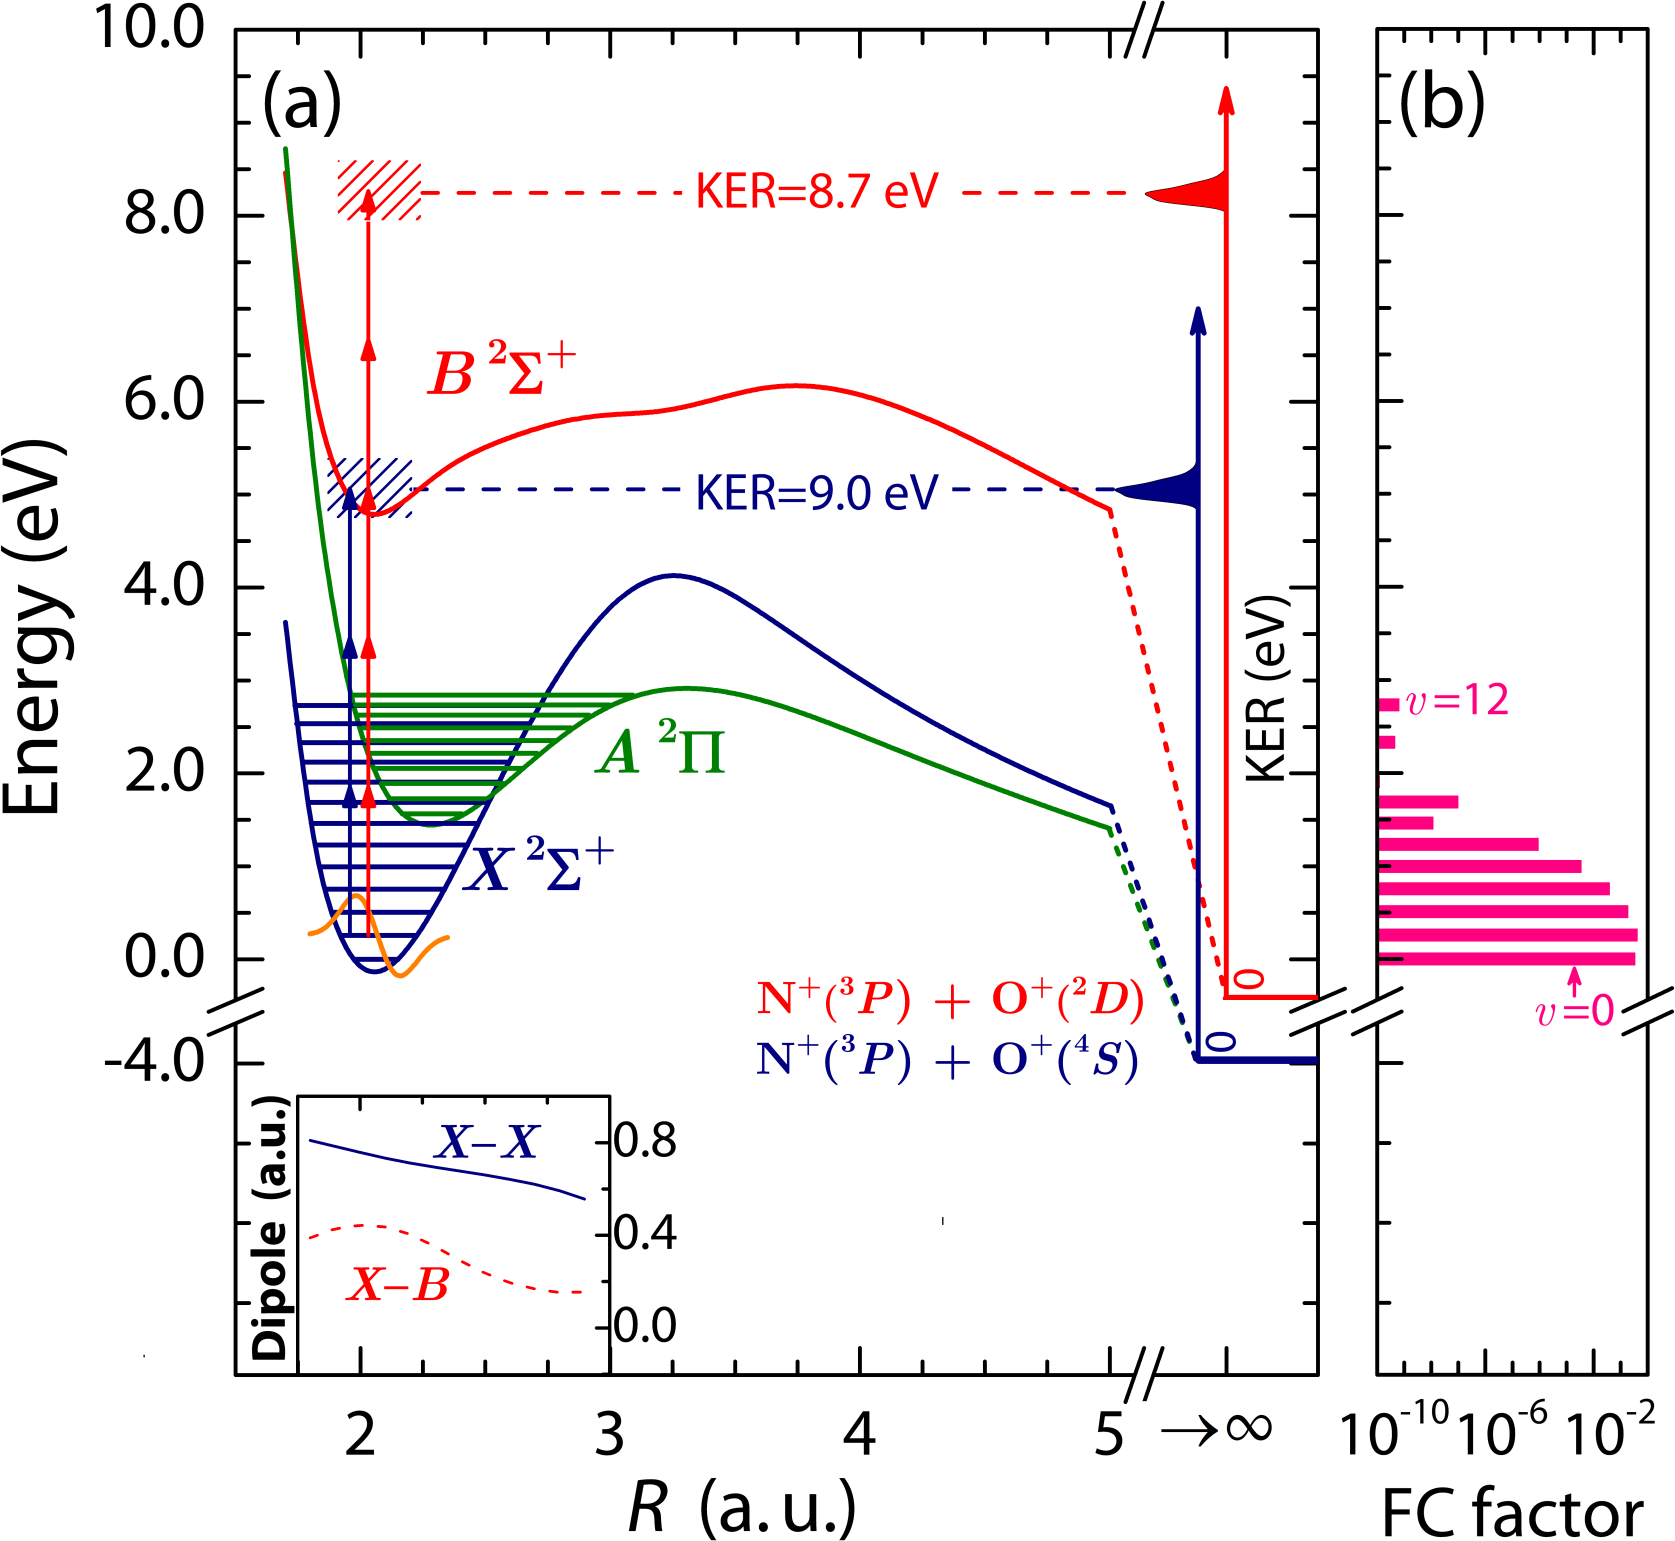
Lifetimes of ions and radicals
Lowest-lying doublet potential energy curves of NO2+. Used for Kinetic Energy Releas experiment.