Star cluster
 The picture shows the dynamic evolution of a globular cluster of 300
stars during 1 billion (109) years. The size of the sky
window is 20 × 20 pc, masses of all stars are equal to the mass of
Sun. The final star density in the center is about 50/pc3.
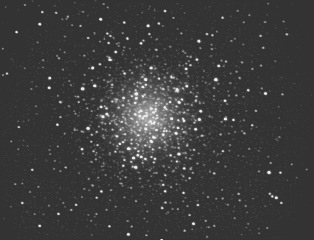
A real globular star cluster M53 (taken from
Al Kelly's CCD Astrophotography Page) is shown below for comparison.
The picture shows the dynamic evolution of a globular cluster of 300
stars during 1 billion (109) years. The size of the sky
window is 20 × 20 pc, masses of all stars are equal to the mass of
Sun. The final star density in the center is about 50/pc3.
A real globular star cluster M53 (taken from
Al Kelly's CCD Astrophotography Page) is shown below for comparison.
 The inital configuration of the MD simulation was a cloud with
Gaussian distribution of star positions. The inital velocities were
drawn from the Maxwell-Boltzmann distribution with "temperature" chosen
so that the initial "pressure" = 2×(kinetic energy) + (potential
energy) was zero. This condition is far from equilibrium and
therefore the time evolution of "pressure"
exhibits an increase in the first about 50 M year during which 8 stars
escape ("evaporate") from the cluster. The remaining cluster of 292
stars seems to be stable (escape rate less than a few/G year)
although the "pressure" still oscillates.
The inital configuration of the MD simulation was a cloud with
Gaussian distribution of star positions. The inital velocities were
drawn from the Maxwell-Boltzmann distribution with "temperature" chosen
so that the initial "pressure" = 2×(kinetic energy) + (potential
energy) was zero. This condition is far from equilibrium and
therefore the time evolution of "pressure"
exhibits an increase in the first about 50 M year during which 8 stars
escape ("evaporate") from the cluster. The remaining cluster of 292
stars seems to be stable (escape rate less than a few/G year)
although the "pressure" still oscillates.
 The simulation was performed using MACSIMUS with a simple sign change
transforming electrostatic repulsion of ions into gravitational
attraction of stars. The time step was 250 years. To avoid close
collisions, a Lennard-Jones potential was added to the star-star
gravitational force; an apparent artifact of this approach is
occurence of about 1 per cent of "double stars" kept together by this
additional attraction (equilibrium distance about 0.018 pc). The
maximum relative error of total energy conservation during the run was
1.2×10⁻⁵, standard deviation
3.5×10⁻⁷.
The simulation was performed using MACSIMUS with a simple sign change
transforming electrostatic repulsion of ions into gravitational
attraction of stars. The time step was 250 years. To avoid close
collisions, a Lennard-Jones potential was added to the star-star
gravitational force; an apparent artifact of this approach is
occurence of about 1 per cent of "double stars" kept together by this
additional attraction (equilibrium distance about 0.018 pc). The
maximum relative error of total energy conservation during the run was
1.2×10⁻⁵, standard deviation
3.5×10⁻⁷.
[back to J. Kolafa homepage]